

Internal project, anonymized
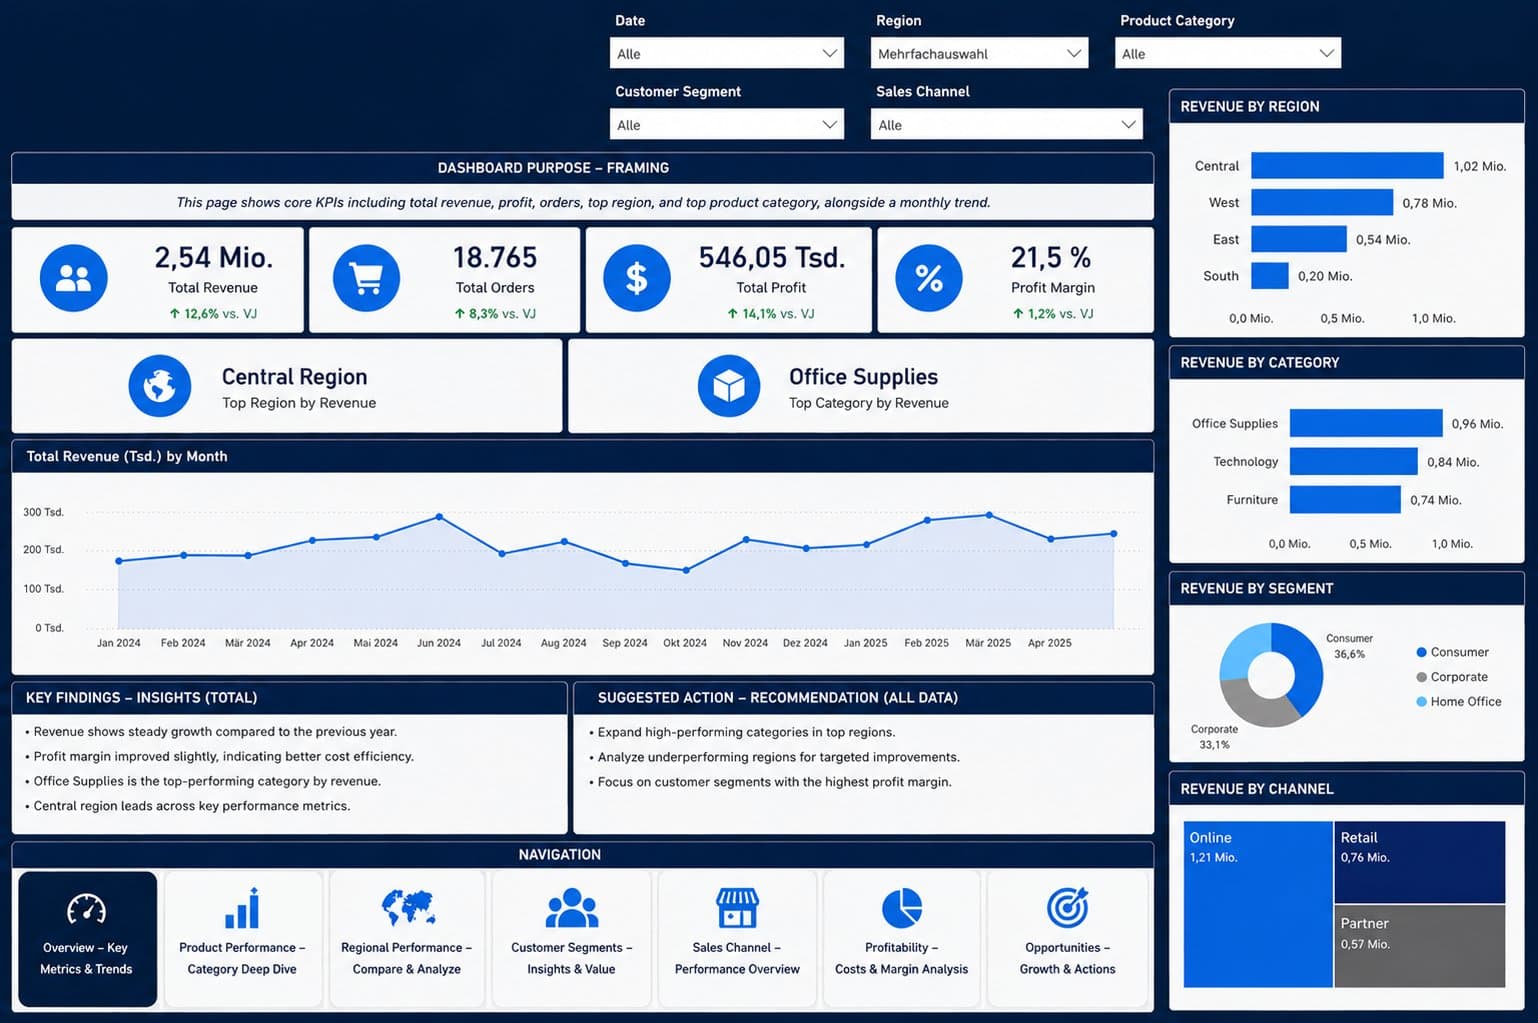
Power BI Executive Dashboard
Star-schema data model and automated KPIs instead of monthly hand-maintained reporting spreadsheets.
- Industry
- Business Intelligence
- Problem
- Leadership received monthly metrics from manually maintained reporting spreadsheets. Every change to a metric or data source meant manual work in several places at once.
- Solution
- Power BI dashboard with a clean star-schema data model, a Power Query ETL layer, and DAX metrics that refresh automatically.
- Result
- Consistent KPIs across all levels, no more manual upkeep when new data lands.
- Tools
 Power BI
 Power Query
 DAX
DAX SQL
SQL
Related services
/ Next step
Tired of manual reports?
Briefly describe which metrics are still assembled by hand today.